Food Chemistry Project – 1 – Finding Atoms
Let’s start to get a little more practical!
You’ve just learned all about atoms. You’ve also just learned which types of elements you’d be most likely to find in your food.
Let’s have a look at an actual example, by having a look at your chosen food product.
Using nutritional labels to find elements
Over the years, scientists have analyzed a wide range of food to determine what they are made up of. Online, you’ll be able to find these results in a range of different databases. A lot of countries have their own databases with publicly available information.
Knowing what your food is made of is the starting point for studying the chemistry of your food. Once you know what components your food is made, you can start to understand how these can react and behave during cooking, storage, etc.
One of the largest (English) databases available is from the USDA (from the United States). However, your own home country might have resources available as well. For instance, in the Netherlands, the tool is called NEVO (Nederlands Voedingsstoffenbestand) which is also freely accessible. The UK has a tool as well, which requires registration. For this exercise, it doesn’t matter which tool you use, as long as you use one. For our example we’ll use the USDA Food Data Central tool.
- USA – USDA Food Data Central: https://fdc.nal.usda.gov/
- Netherlands – NEVO: https://nevo-online.rivm.nl/
- UK – Food Databanks: https://quadram.ac.uk/UKfoodcomposition/login-register/ (requires an account)
The Assignment
We are going to use these databases to find some of the elements that we just discussed.
Just about any food will contain large amounts of carbon (C), oxygen (O), nitrogen (N), and hydrogen (H) atoms, the major atoms. However, these are generally part of larger structures, molecules, which we’ll look at later. It’s why for now you can skip the carbohydrates, proteins, and fats sections of the nutritional databases.
Luckily, some of the minor elements that we discussed (e.g. sodium (Na) and calcium (Ca)) are often given individually. We refer to these minor ingredients as minerals. It’s important that we eat enough of these specific elements, thus analyzing them is quite common.
So, take your chosen food. Look it up in one of the databases, and have a look at the ‘minerals’ section. Write down which minerals are present in your food. If you want, you can compare the contents with another product.
Next, look up the periodic table. For the 5 most prevalent elements in your product, write down their atomic weight.
Note: the atomic mass/weight can be given in the unit “u”. Here we can assume that 1 u = 1 g/mol. In reality, it’s a little more complex, but for our purposes, we can make this simplification.
Below you can find an example of this exercise in the product we chose as a demo: apples.
Example: Apples
We had chosen the apple as our reference food product. In the USDA database there is data for a whopping 5 different varieties of apples! We decided to just look at Honeycrisp and Granny Smith apples.
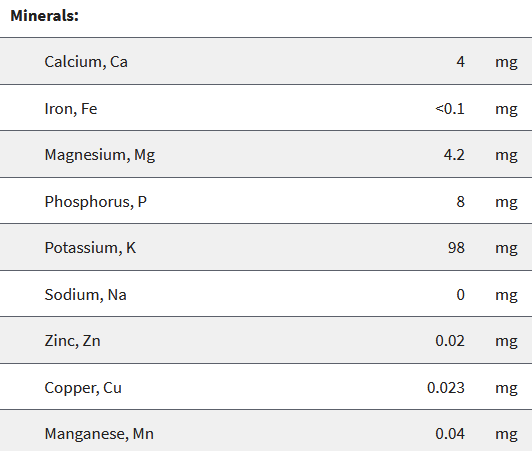

Notice how apples contain a lot of different elements. But, also notice just how little of each they contain! You can see some slight differences between apple varieties, but these are minor and not very relevant.
So let’s have a look at the atomic weight of the most common of these minerals in our apples:
- Potassium (K): 39,1 g/mol
- Phosphorus (P): 30,97 g/mol
- Magnesium (Mg): 24,3 g/mol
- Calcium (Ca): 40,08 g/mol
- Iron (Fe): 55,84 g/mol
Why do this exercise?
Your food is made up of a whole collection of atoms. This exercise will help you start to get a feel for what your food is made of and how to analyze/interpret it.
Share!
If you want to, share your results below, or ask a question by leaving behind a comment.
Banana
5 Most common mineral’s atomic weights:
Mg – 24.305
K – 39.098
P – 30.974
Ca – 40.078
I – 126.90
👍
I have looked up Lemon (flesh and juice only, 66% excluding skin, pith and seeds) on the Food Standards Australia New Zealand Database:
(https://www.foodstandards.gov.au/science/monitoringnutrients/afcd/Pages/fooddetails.aspx?PFKID=F005174)
Minerals: per 100 gm atomic weight
Ca 20 mg 40.08
Fe 0.3 mg 55.85
Mg 9 mg 24.31
P 16 mg 30.97
K 120 mg 39.10
Se 0.4 mg 78.96
Na 2 mg 22.99
Zn 0.1 mg 22.99
Here are the mineral contents of lemons, peeled, raw, flesh and juice, according to the Food Standards Australia New Zealand https://www.foodstandards.gov.au/science/monitoringnutrients/afcd/Pages/fooddetails.aspx?PFKID=F005174
and the atomic weight of each element:
1. Potassium (K) 39.098 g/mol
2. Calcium (Ca) 40.078 g/mol
3. Phosphorus (P) 30.974 g/mol
4. Magnesium (Mg) 24.305 g/mol
5. Sodium (Na) 22.99 g/mol